Slicing the Pie: Examining the WSOP Main Event Payouts and $10M First-Place Guarantee

Dates for the 2015 World Series of Poker were announced just before Christmas, and the announcement brought with it some controversy over the return of the $10 million guaranteed prize for first place in the Main Event. Daniel Negreanu was one of many weighing in with an opinion on the decision to bring back the first-place guarantee:
Re: WSOP main event payouts. I agree strongly that flatter payouts are more important than guaranteeing a $10 mill 1st prize. Increasing...
— Daniel Negreanu (@RealKidPoker)
The chances of cashing, increases the chance that recreational players will play not only this year but in future years.
— Daniel Negreanu (@RealKidPoker)
There was enough of a kerfuffle over the issue that earlier this month the WSOP decided to send out a survey about Main Event payouts.
To understand how the first-place guarantee affects payouts for everyone else, it helps to know how payouts for the Main Event (and most other large poker tournaments) are devised. Let’s look a little closer at how tournament payouts are determined as well as the recent history of the WSOP Main Event, then see if we can come to a conclusion about the effect that $10 million guarantee has on the overall payouts.
Recent History
The payout structure for the Main Event has changed dramatically over the years. As recently as 1999, when there were only 393 entries, first prize was $1 million while the bottom rung of payouts (for places 28th-36th) made a measly $5,000 profit after the $10,000 buy-in.
Seven years later there was a record-breaking 8,773 entries in the 2006 WSOP Main Event. That year Jamie Gold took a record $12 million for first place, but the folks on the bottom (820th-873rd) got just $14,597, with 11 players tying for 873rd place profiting just $616 for their hard work. About 1/6 of the players who cashed in 2006 made less than $6,500 in profit. On the other hand, the bottom rung of the payout structure for 2014 earned a little more than $8,400 over the buy-in.
After 2006, the WSOP and the Players Advisory Council worked to come up with a flatter payout structure that would provide a little more cash for the bulk of players. It was adjusted again for the 2010 series.
As in many tournaments, each position at the WSOP Main Event final table is a separate payout tier, increasing dramatically from ninth place to first. Meanwhile below the final table, the second table is structured into three payout tiers: 10th-12th, 13th-15th, and 16th-18th. The third table (places 19th-27th) is its own tier, with eight more tables/tiers down to 99th place.
Below 99th place, each tier contains multiple tables ranging from seven (63 places per tier), to eight (72 places), to nine (81 places). The total number of places paid is approximately 10% of the number of entries — it was a little less in 2008 and 2009 — with a total of 29 or 30 payout tiers in recent years.
Despite the guarantee on first place in 2014, a higher percentage of players were paid (10.4%) than in the previous six years. You can see from the number of entries and payouts for the years below that 2008 had over 150 more entries in the Main Event than 2014, but three fewer tables received payouts:
| Group Size | 2014 (6,683 entries) | 2013 (6,352) | 2012 (6,598) | 2011 (6,865) | 2010 (7,319) | 2009 (6,494) | 2008 (6,844) |
|---|---|---|---|---|---|---|---|
| single player | places 1-9 (9 tiers) | 1-9 (9) | 1-9 (9) | 1-9 (9) | 1-9 (9) | 1-9 (9) | 1-9 (9) |
| three players | 10-18 (3 tiers) | 10-18 (3) | 10-18 (3) | 10-18 (3) | 10-18 (3) | 10-18 (3) | 10-18 (3) |
| one table (nine players) | 19-99 (9 tiers) | 19-99 (9) | 19-99 (9) | 19-99 (9) | 19-99 (9) | 19-99 (9) | 19-99 (9) |
| seven tables (63 players) | 100-477 (6 tiers) | 100-351 (4) | 100-162 (1) | 100-477 (6) | 100-288 (3) | 100-666 (9) | |
| eight tables (72 players) | 478-693 (3 tiers) | 352-567 (3) | 162-666 (7) | 478-693 (3) | 100-747 (9) | 289-646 (5) | |
| nine tables (91 players) | 568-648 (1) |
The amounts of payouts for most large poker tournaments are derived from a formula. Each payout tier is a more or less evenly-spaced point along an axis of some sort of curve, and the intersections of lines drawn from the points to the curve determine how much each tier of payouts is going to get. Then you figure how many people are included in each tier and adjust the payout amounts up or down a little bit until the total you’re paying out matches the money in the prize pool.
Introducing the $10M Guarantee for First
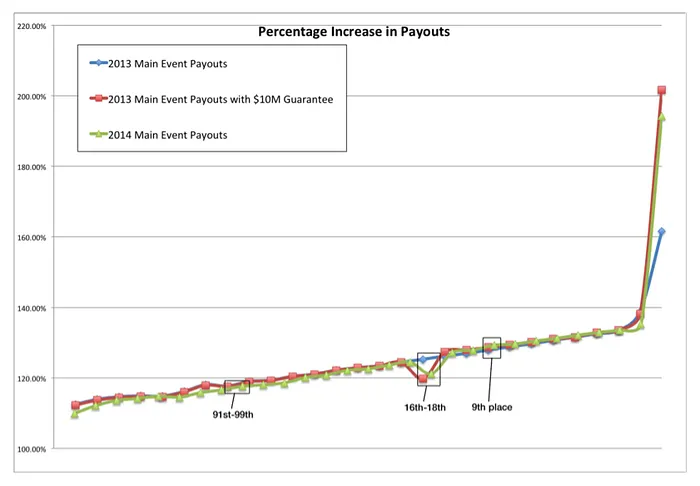
I don’t have the exact formula for calculating WSOP Main Event payouts, but I’ve plugged some numbers into a spreadsheet so that I can make some approximations. The graph below shows actual payout figures for the 2013 and 2014 Main Events, combined with figures from a WSOP document estimating how 2013 payouts would be affected with a $10 million guarantee for first place. The estimated effect was a 3% reduction in payouts across the board. At the bottom end, that meant a reduction to $18,864 from $19,107 for places 568th-648th — i.e., $243, or less than 2.5% of each player’s buy-in. (You can click the graphs to enlarge.)
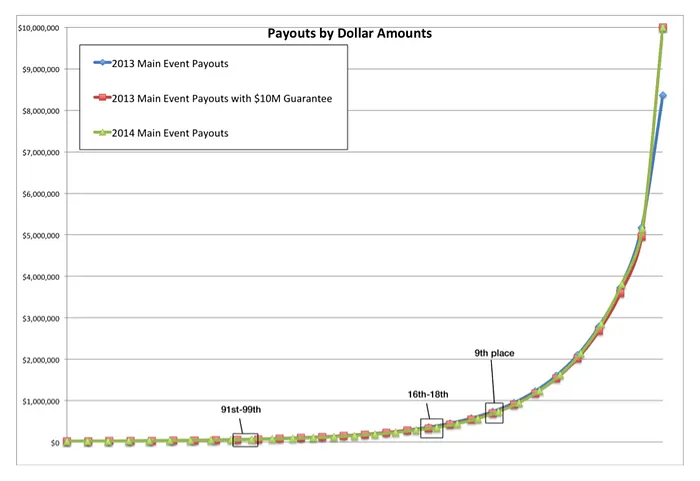
Though it looks as if the bottom end of the curve goes down to zero, that just shows how much less you get for cashing on the bottom end of the payout structure compared to the final table. The graph (and those that follow) identifies key payout tiers; the points on the curve for 2014 have a different horizontal spacing because there’s an extra payout tier on that line. All three structures appear to follow the same curve — not too surprising, since they’re probably based on the same formula.
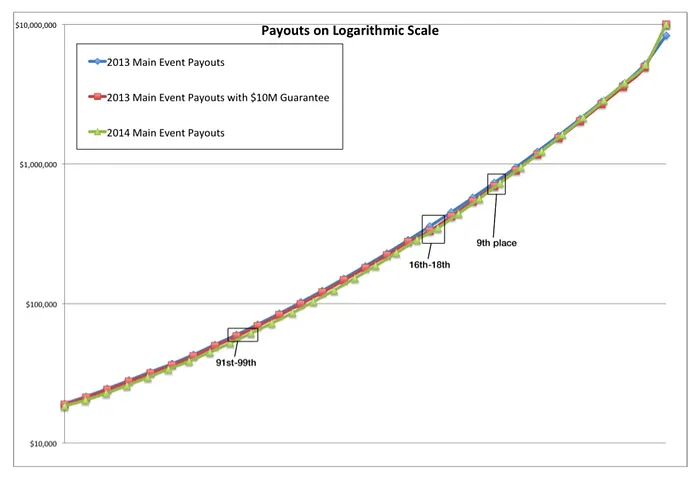
A logarithmic graph of the same data makes it obvious that the increase in payouts between the tiers isn’t a simple geometric progression (which would appear as a straight line). In other words, you can’t just take the payout from one level, apply a factor x to the value to get the next payout, and then multiply the new value by x again to find the payout level beyond that. We need to look at the pace of the increase to approximate the formula.
Each payout tier is larger than the one before it. The following graph shows the percentage increase from one tier to the next, starting on the left with the increase from the first tier ($19,107 in 2013, $18,406 in 2014) to the second tier ($21,495 and $20,228, respectively).
For example, in 2014 the payout for the 28th-36th tier was $230,487 and the payout for 19th-27th was $286,900, which is 124% of the smaller number. This graph — with a couple of exceptions — shows the amount of increase itself increasing on a nearly straight line for most of its length, meaning the rate of increase is relatively constant. In fact, the points for the actual (blue) and projected guarantee (red) lines for 2013 are identical in all but two positions, with an anomaly in the bottom tier of the second table (places 16th-18th) and an expectedly-whacko jump for first place, even in the case of the actual pre-guarantee payouts.
(NOTE: There appears to be a glitch in the jump from 19th to 18th place in the $10 million guarantee structure calculations; the payout amount doesn’t go down, but the increase drops for 16th, 17th, and 18th places, who got $347.5K instead of the $359.5K they would have received under a smooth increase. Then the increase for the next tier is actually larger than normal, which puts the series back on track.)
Unlimber the calculus section of your brain, and take a look at the rate of the payout increase. If you have three tiers of increasing payouts (T0, T1, and T2), the percentage increase from T0 to T1 is T1/T0. This graph is (T2/T1)/(T1/T0). The bottom tier of payouts in 2014 was $18,406. It went up 109.9% for the next tier, to $20,228. The next tier paid $22,678, an increase of 112.1%. The rate of increase is 112.1/109.9 = 102% (which is the first point on the green line for 2014 on the graph below).
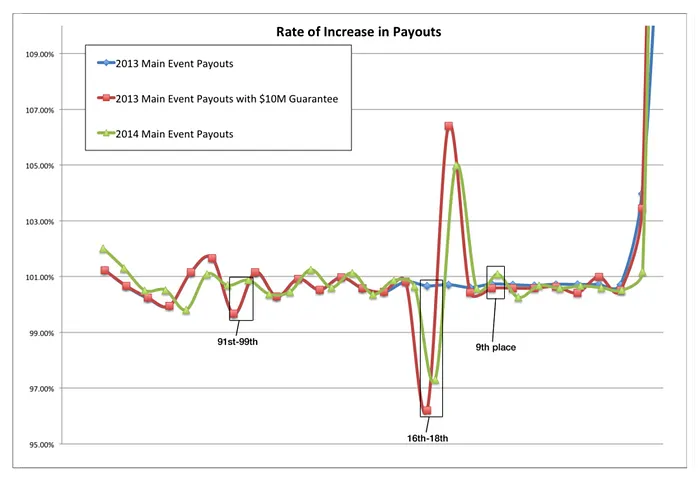
As it turns out, the formula oscillates around a rate of increase just under 101% for all three sets of data. Most of that is likely caused by adjustments to tier payouts to match the total amount paid to the prize pool. The actual payouts for the 2013 Main Event have a median rate of increase of 100.72%; those for 2014 (with the first-place guarantee) have a median rate of increase of 100.66%.
First place is cut off on this graph, but it’s obvious from the right-most point shown that the person who suffered the most in 2014 was second-place finisher Felix Stephensen, who had a much lower rate of increase in his payout than he would have in 2013, although that translates to about a $30K difference for a prize of more than $5 million dollars.
Conclusion
What’s it all mean? Well, if you’ve been freaking out about how the extra money paid to first place is sucking the poker economy dry, you don’t even need all my graphs to figure out that things aren’t that different.
The 2014 Main Event was about 7% larger than the year before. Main Event champion Ryan Riess won $8.36 million in 2013. The $1.64 million difference between that amount (in a smaller field, with fewer payouts) and the $10 million Martin Jacobson won in 2014 comes to about $2,370 from every other player who cashed in the tournament. Most of it came from players who cashed in the top 100 positions, not the other six hundred people who made it past the bubble.
Darrel Plant lives in Portland, Oregon. A computer programmer by profession and a game player at heart, he writes about math and poker at his blog, Mutant Poker. For an even deeper look into the WSOP Main Event payouts, see his post “Satisfaction Guarantee.”
Get all the latest PokerNews updates on your social media outlets. Follow us on Twitter and find us on both Facebook and Google+!