Paying the Top 1,000: Comparing 2014 WSOP Main Event Payouts with 2015 Changes

As mentioned in last week’s examination of how the $10M guarantee for first place affected the payout structure of the World Series of Poker Main Event, organizers sent a survey out to the poker community seeking opinions about what could be improved. The results have apparently been tabulated, because, as reported here yesterday, the WSOP has rescinded the $10M guarantee, as well as made some other changes.
The WSOP’s announcement included a chart of final table and selected lower-level payouts based on the number of 2014 entries. The change that will affect most players is the addition of more than 300 payouts of $15,000 to make it possible for each of the top 1,000 finishers to get a piece of the prize pool pie. (In order to pay the top 1,000, the Main Event will need to draw at least 5,000 entrants, which it has done every year dating back to 2005.)
If in place last year, that would have meant over $4.6 million (7.3%) of the $62.8 million prize pool would have gone to players who last year received nothing, with the money bubble likely breaking on Day 3 instead of Day 4. For a field of 6,683, 1,000 payouts would mean the percentage of cashing players increases from just over 10% to nearly 15%. The other significant change is a modification so that the minimum amount paid to a member of the November Nine is $1,000,000, something that hasn’t been the case since 2009.
Below the top 12 places, payouts were given for places 50, 100, 500, and 693, the last place paid in 2014. Not all of the payout tiers are shown in the WSOP’s announcement, but this table shows the payout tiers for 2014 and the new amounts, where they are available:
| Payout Ranks | Actual Payouts 2014 | Payouts for 2015 | Percentage Change |
|---|---|---|---|
| 1 | $10,000,000 | $8,000,000 | -20.0% |
| 2 | $5,147,911 | $4,663,527 | -9.4% |
| 3 | $3,807,753 | $3,500,000 | -8.1% |
| 4 | $2,849,763 | $2,750,000 | -3.5% |
| 5 | $2,143,794 | $2,000,000 | -6.7% |
| 6 | $1,622,471 | $1,500,000 | -7.5% |
| 7 | $1,236,084 | $1,250,000 | +1.1% |
| 8 | $974,172 | $1,100,000 | +1.6% |
| 9 | $730,725 | $1,000,000 | +36.8% |
| 10-12 | $565,193 | $550,000 | -2.7% |
| 13-15 | $441,940 | ||
| 16-18 | $347,521 | ||
| 19-27 | $286,900 | ||
| 28-36 | $230,487 | ||
| 37-45 | $186,388 | ||
| 46-54 | $152,025 | $142,500 | -6.3% |
| 55-63 | $124,447 | ||
| 64-72 | $103,025 | ||
| 73-81 | $85,812 | ||
| 82-90 | $72,369 | ||
| 91-99 | $61,313 | ||
| 100-162 | $52,141 | $50,000 | -4.1% |
| 163-225 | $44,728 | ||
| 226-288 | $38,634 | ||
| 289-351 | $33,734 | ||
| 352-414 | $29,400 | ||
| 415-477 | $25,756 | ||
| 478-549 | $22,678 | $20,850 | -8.1% |
| 550-621 | $20,228 | ||
| 622-693 | $18,406 | $16,750 | -9.0% |
| 694-1,000 | $0 | $15,000 |
And here’s a logarithmic graph of the payout curve for all of the places that paid in 2014:
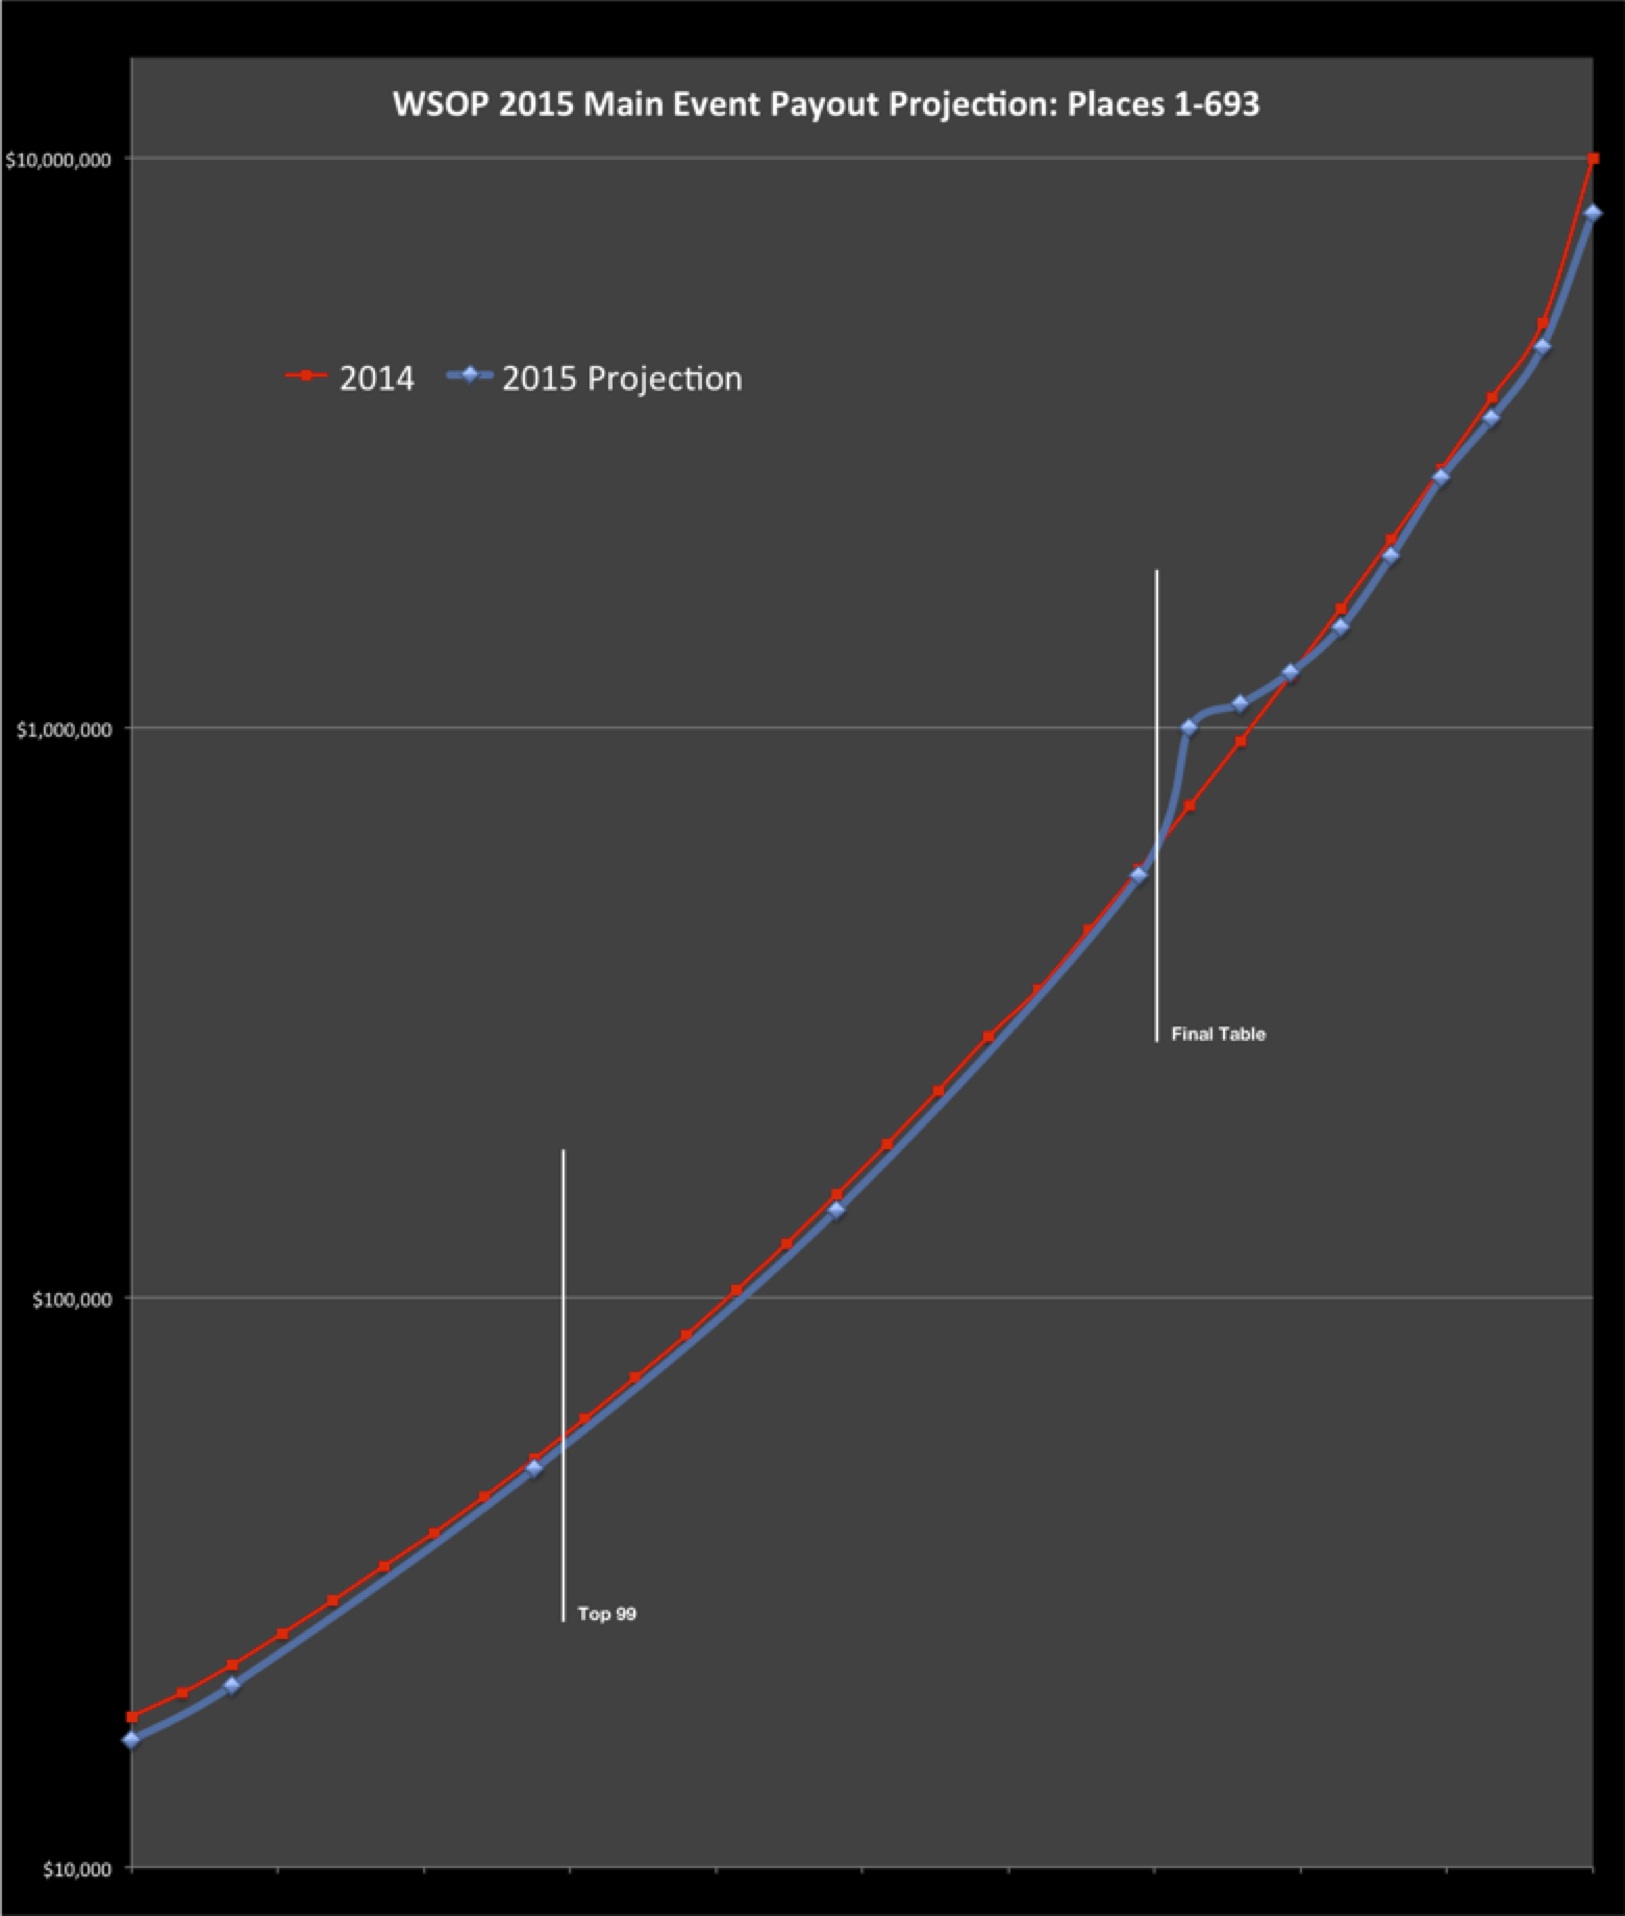
The actual effect of last year’s $10,000,000 guarantee on the rest of the prize pool was minimal — about a 3% reduction across-the-board — though it seemed to loom large in the minds of many. The manner in which money is redistributed in this proposal will probably make a bigger change. That $4.5M for the new bottom rung of the payout structure has to come from somewhere, after all.
Based on the WSOP figures, more than $2.7 million — about half — would come from changes in the final table payouts, even with the bump given to eighth and ninth places. The rest comes out of everyone else’s prizes with the biggest decrease percentage-wise coming off the bottom end of the curve where there is a reduction of 8-9% — a bit more of a bite than they took from the $10M guarantee.
On the other hand, everyone who plays will have a 50% better chance of cashing in the Main Event.
Darrel Plant lives in Portland, Oregon. A computer programmer by profession and a game player at heart, he writes about math and poker at his blog, Mutant Poker.
Get all the latest PokerNews updates on your social media outlets. Follow us on Twitter and find us on both Facebook and Google+!